During the 2008 presidential election, the overwhelming popularity of Barack Obama led many people to believe that racism was declining in the United States.
Surely, people theorized, he wouldn’t be as successful if people were still prejudiced. The polls even seemed to confirm the assumption that racism was on the decline and mainly limited to the South. But they were wrong.
In Everybody Lies: Big Data, New Data, and What the Internet Can Tell Us About Who We Really Are, data scientist Seth Stephens-Davidowitz examines Google search trends to show that racism was by no means in decline. He was particularly surprised to find a significant number of racist searches on the East Coast.
Stephens-Davidowitz also compared the search trends with voting patterns in the 2012 primaries. It all lined up; in districts where there were high volumes of racist searches, John Kerry, a white candidate, performed much better than Obama. The map also aligned with voting patterns of the 2016 general election, with the same districts voting for Donald Trump.
So what happened?
Well, humans are pretty unreliable. When surveyed, we tend to put our best feet forward and provide the answers we think people want to hear. Whether it’s a conversation with a doctor, researcher, or academic advisor, we often end up lying to others (and ourselves). It’s likely, according to Stephens-Davidowitz, that the polls of East Coast voters didn’t uncover racism because the respondents lied to avoid being perceived as racist.
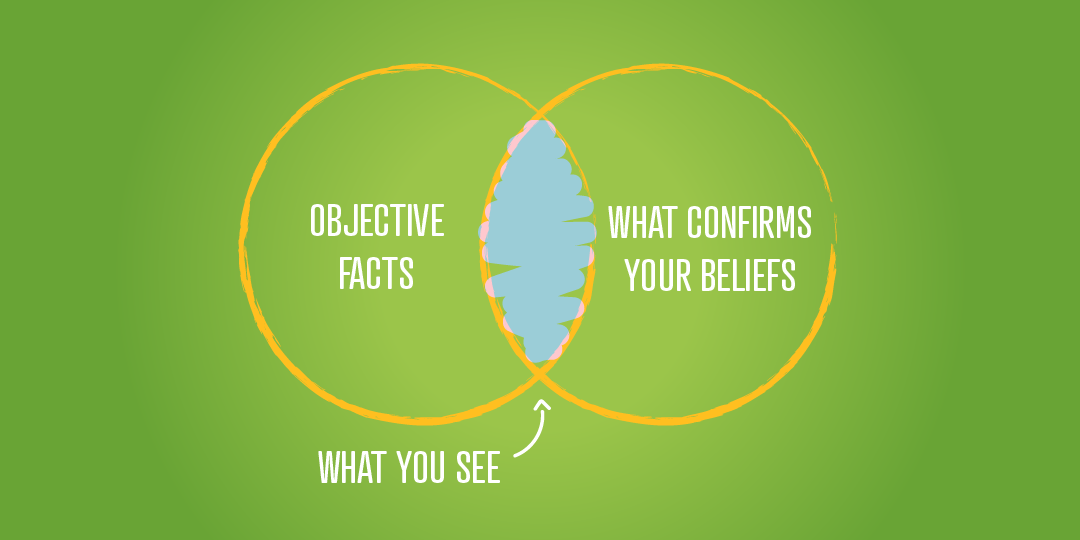
Our perceptions can override data that’s right in front of us. The pollsters in 2008 fell victim to what data scientists call confirmation bias.
As student affairs professionals, we likely won’t ever work with data sets as large as all American voters. But we collect data all the time, and whether it’s event attendance, retention rates, or co-curricular learning outcomes, it’s vital for our data to be accurate.
There are many types of biases that can affect your ability to collect and analyze good data. If you collect student opinions, assessment statistics, or participation rates, this post is for you.
Bias in Research
Implicit biases can affect the reliability of data throughout every part of the research process.
This type of bias involves learned stereotypes or assumptions about a certain group of people, which can affect our treatment of them. Being an effective researcher means constantly questioning your methods and transparently sharing when, where, and how they might impact your data. We recently published a post on ways you can check your unconscious bias.
1. Implicit Bias in Surveys
Surveys are the go-to for many of us when collecting data. They’re quick, cheap, and easy to distribute. The problem is that we can often end up creating surveys that are more a reflection of ourselves than the people we survey.
When researching the working lives of taxi drivers, sociologist Nicole Westmarland found bias in the choice of words used in the survey:
“If I used my definition of violence, am I implying that my definition of violence is more accurate (more ‘true’?) than the taxi drivers’ own definitions? … For example, instead of asking, ‘Have you ever experienced physical violence at work?,’ it would be possible to break this question into interrelated questions, such as ‘Have you ever been hit at work?’ and ‘Have you ever been hit with an object while at work?’”
In that study, Westermarland found that women were less likely to report instances of sexual violence at work when surveyed using broad terms and questions. Even the slightest shift in survey language can influence responses.
By not questioning our own experiences or understandings, we presume that everyone thinks like us and interprets language in the same way.
2. Confirmation Bias
Confirmation bias occurs when we seek out data that confirms our beliefs. Our search can even lead us to subconsciously disregard data that is incongruent with our expectations.
For example, if a friend introduces you to an old TV show or movie, you might start seeing advertisements for it everywhere. You may hear more people talking about it on the train or in a coffee shop, and think that it’s suddenly become more popular. Chances are it hasn’t; chatter about it has always been there, but your brain is noticing it more now that you’re on the lookout for it.
This is called the Baader-Meinhof phenomenon and is rooted in confirmation bias.
Let’s say that as part of a review of a study abroad program, you analyze students’ post-program reflections. You already believe that studying abroad is beneficial to students’ essential skills, cultural competencies, and work readiness. And after reading through the responses, you declare the program a success and say that students developed in all the ways listed above.
In this example, you’ve have fallen into the trap of subconsciously filtering responses to confirm what we want to believe. When you’re passionate about something, your investment can unintentionally skew your interpretation of the data.
Additionally, as I’ve already established, respondents tend to reply with answers that they think the researcher wants, which may be the case with the students in this example.
3. Selection Bias
Selection bias occurs when your survey sample isn’t representative of the group you want to apply the data to. This is why rigorous sampling is so important.
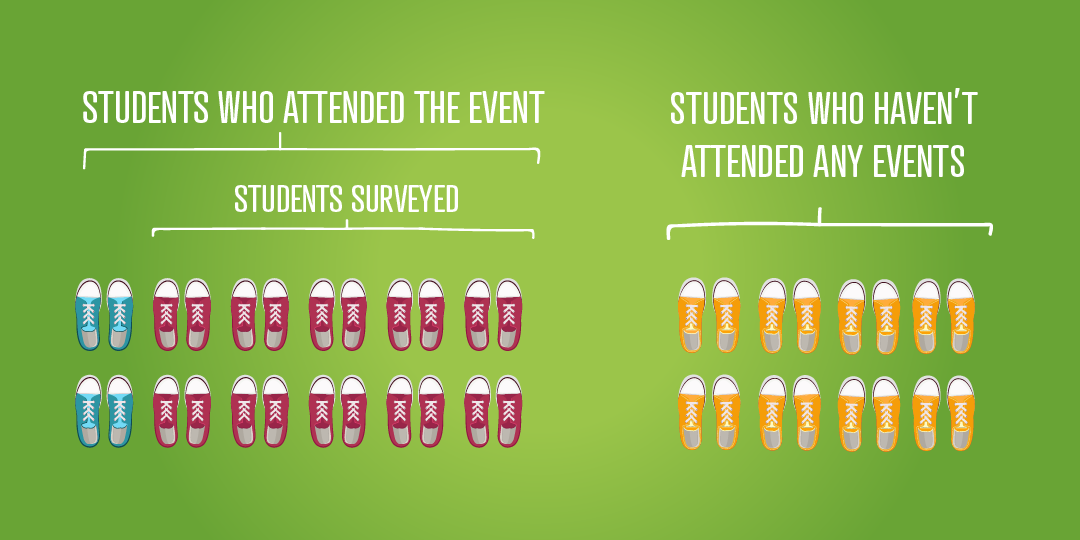
For example, you might theorize that free food is key to program attendance. To check this, you ask students at the start of a particular program, “Would you like to see more events with free food?” Three-quarters of the students say yes, so you conclude that 75% of students want events with free food.
Yet, in reality, only 75% of students who attended that event want more events with food. You wouldn’t be able to generalize this data to students who attend other types of events or aren’t engaged in student activities at all.
To avoid selection bias, you need a truly representative sample. There are a number of sampling methods to help with this, such as quota sampling or cluster sampling.
You could also gather this data by using a student engagement platform. When integrated with your institution’s student information system, you can see data of all students at your institution, not just of those who show up.
4. Observer Bias
We might not perform many observational studies in student affairs, but observer bias can still affect our research processes. Similar to confirmation bias, observer bias occurs when we make an assumption based on what we see or hear — which might vary from person to person.
If, for example, a staff member attends an event and notices that the student attendance is double that of last year, they may say it was very well attended. Yet, a second staff member, who is attending for the first time, may compare the attendance in relation to the room capacity and believe it to be a failure.
Fortunately, most student engagement platforms have event check-in systems that can produce much more accurate attendance reports.
Bias in Data Analysis
Bias doesn’t end with the design and collection process. Even after collecting data, you can fall victim to oversights and prejudices.
In her book Invisible Women, journalist Caroline Criado Perez notes that the skeletal remains of a tenth-century Viking warrior were presumed to be male for over one hundred years, simply because they were found alongside weapons. Despite the skeletal remains bearing the characteristics of a body that was female-assigned-at-birth, archaeologists held onto this assumption because only men were seen as warriors. It wasn’t until DNA testing came along that everyone agreed the body did, in fact, belong to a woman.
Here are some of the other ways that bias can influence our data interpretation:
5. Confounding Variables
Anyone who has taken a research methods class will probably remember the phrase “Correlation does not imply causation.” The principle here is that we may find a correlation between our variable and target audience, even when another variable is the real cause.
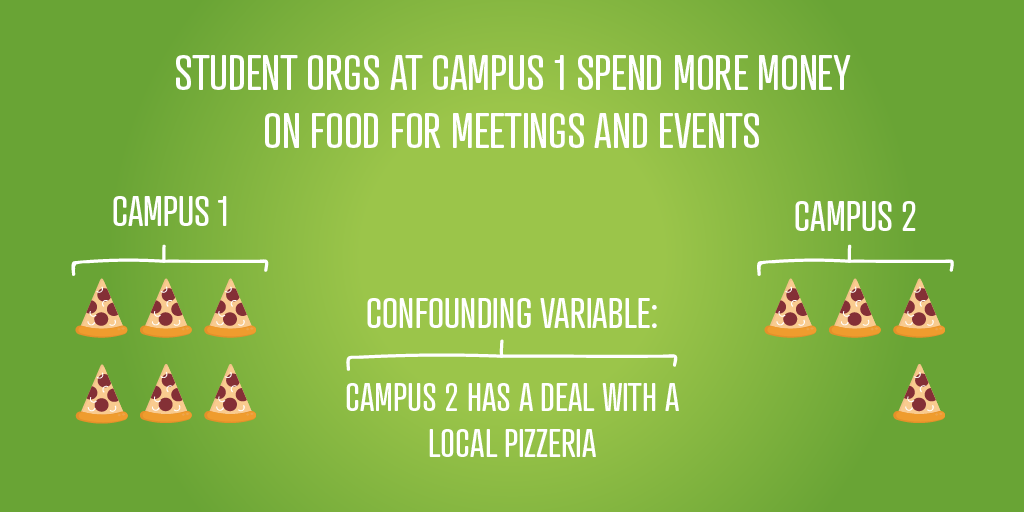
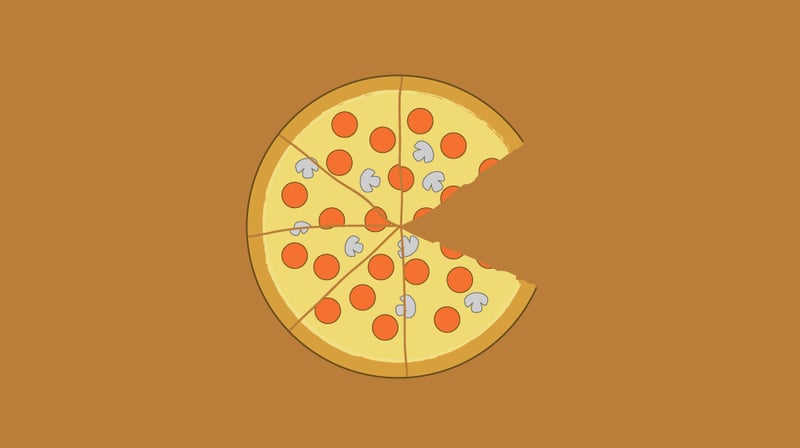
In the above example, you might be using data from your finance platform to understand how student organizations are spending their money.
By looking at the numbers, you can see that students organizations from campus one are spending more money on their events than those from campus two. You might chalk this up to poor budget management from students on campus one and start to review their finance training. The confounding variable here, though, is that campus two has a deal with a local pizzeria, and that’s the reason why they spend less on food.
The takeaway here is that just because two things may correlate, they might not interplay as a direct cause and its result, even if that is what our suspicion is telling us. Take a look at the wider picture and examine what other factors might be at play.
6. Affinity Bias
This common type of bias means that we’re more likely to sympathize with people who look like us and share our experiences. Helen Turnball, CEO of Facets, did a great job of explaining this in her TED talk:
This means that we might overlook information that seems like no big deal to us (based on our own experiences and world views), but could have huge implications for another demographic of students.
For example, you might notice that the majority of students have free time after class, without realizing that scheduling programs then will cause a conflict for students with childcare responsibilities or part-time jobs. If you didn’t have those additional responsibilities when you were in college, you might not see these as barriers to participation.
Bias in Presentation
So you’ve done all the hard stuff: Collected your data and analyzed it. You should be home free, right? Well, presenting your data can still leave you open to bias.
Take a moment to think about how you consume a lot of data in your everyday life. Whether it’s on television, social media, podcasts, or websites — the way data is presented can change how you think and feel about it and ultimately the conclusions you make.
When we present data, we have to consolidate a lot of information into bite-size chunks. It could be a quick overview of key trends, a random selection of qualitative responses, or a series of recommendations. The process of selecting which data we think is pertinent is fertile ground for implicit bias. We decide not only what we think is interesting but what we think our stakeholders are interested in.
Despite our own preferences about what we might want to achieve with our data, we also need to consider the identities and positionalities of whom the research is being presented to.
If, for example, we conduct qualitative research on the experiences of LGBT students, we might struggle to leverage any change from a board of trustees without putting it into a wider context. We might want to frame the research in the context of reaching broader inclusion or retention goals.

For others to take the research seriously, it’s also important to speak the same language as those you’ll present to. This applies both to upper management and students.
Overcoming Biases
Simply being aware of how your biases can affect your data collection can go a long way in improving the validity of your research. However, there are a few other things you can do to mitigate bias.
Involve others in your research
Partnering with other departments during each stage of research is a great way to spot areas you may have overlooked or data you may have misinterpreted.
Involving students in your research is also crucial to effective assessment. Use students as part of a pilot study or focus group to see whether your research methods are airtight.
Use a mixture of research methods
If you’re using a qualitative method of research, combine it with a quantitative method. Using our previous example of work-ready skills gained from studying abroad, you might be able to combine reflections with a quantitative study of students who successfully gain employment after graduating.
Have you found other types of biases affecting your research? How have you overcome it to discover more accurate data? We would love to hear about it! Tweet us @themoderncampus.